

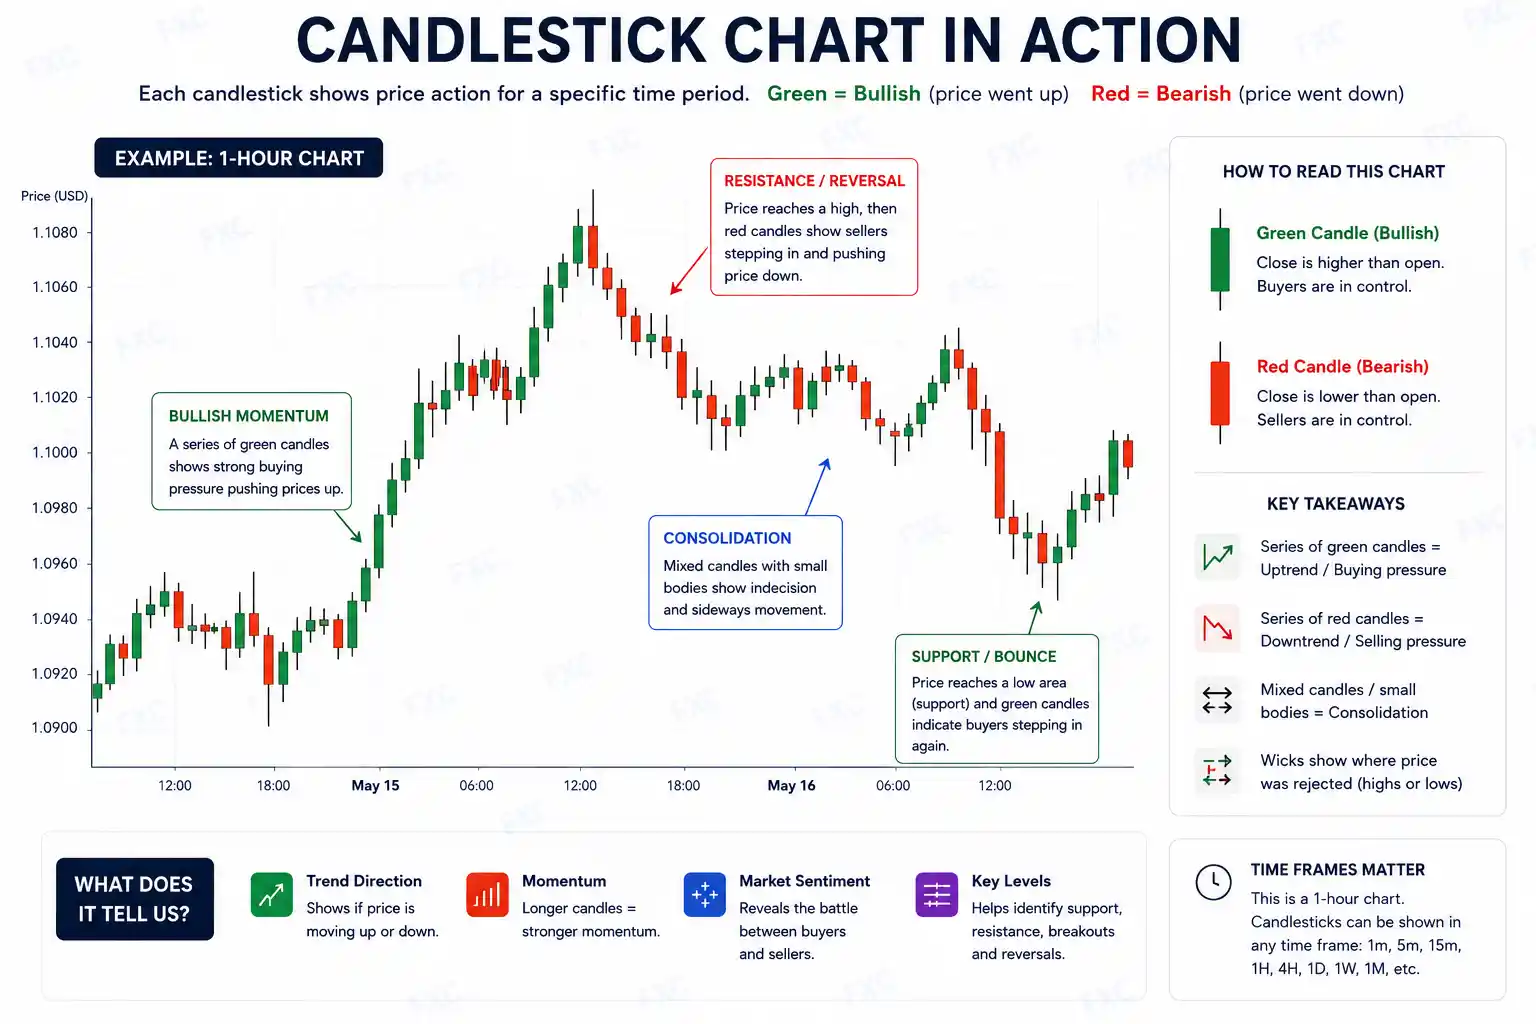
A candlestick is a single element of a candlestick chart that encodes price action for a specific time period. Candlesticks are the most common chart type used by traders to visualise open, high, low and close price data.
What is a candlestick
Put simply, a candlestick shows four values for one chosen timeframe: the opening price, the highest price, the lowest price and the closing price. Traders read these four points to judge who controlled the market during that period.

Origin and short history
Candlestick charts are commonly associated with Munehisa Homma and the rice markets in Japan. Modern candlestick techniques became widely taught in the West after publications and books popularised the method.
Anatomy of a candlestick
Do you want to play in a simulator with real time markets?
Create a 10,000 USD DEMO accountDo you want to create your account and make your first deposit? (min. 10 USD)
Sign Up HereDo you want to know how to make a deposit?
Watch the video hereEvery candlestick is made of a body and optional upper and lower shadows, often called wicks. The body represents the open to close range while the wicks show the high and low for the period. Understanding these parts is essential to reading price rejection, momentum and indecision.
- Open price
- Close price
- High price
- Low price
How to read a single candlestick
- Look at the body to see which side won. A larger body implies stronger buying or selling.
- Check the wicks. Long upper wick after an advance can show selling pressure. Long lower wick after a drop can show buying rejection.
- Always read the candle in timeframe context. A hammer on a daily chart is more significant than a hammer on a one minute chart.
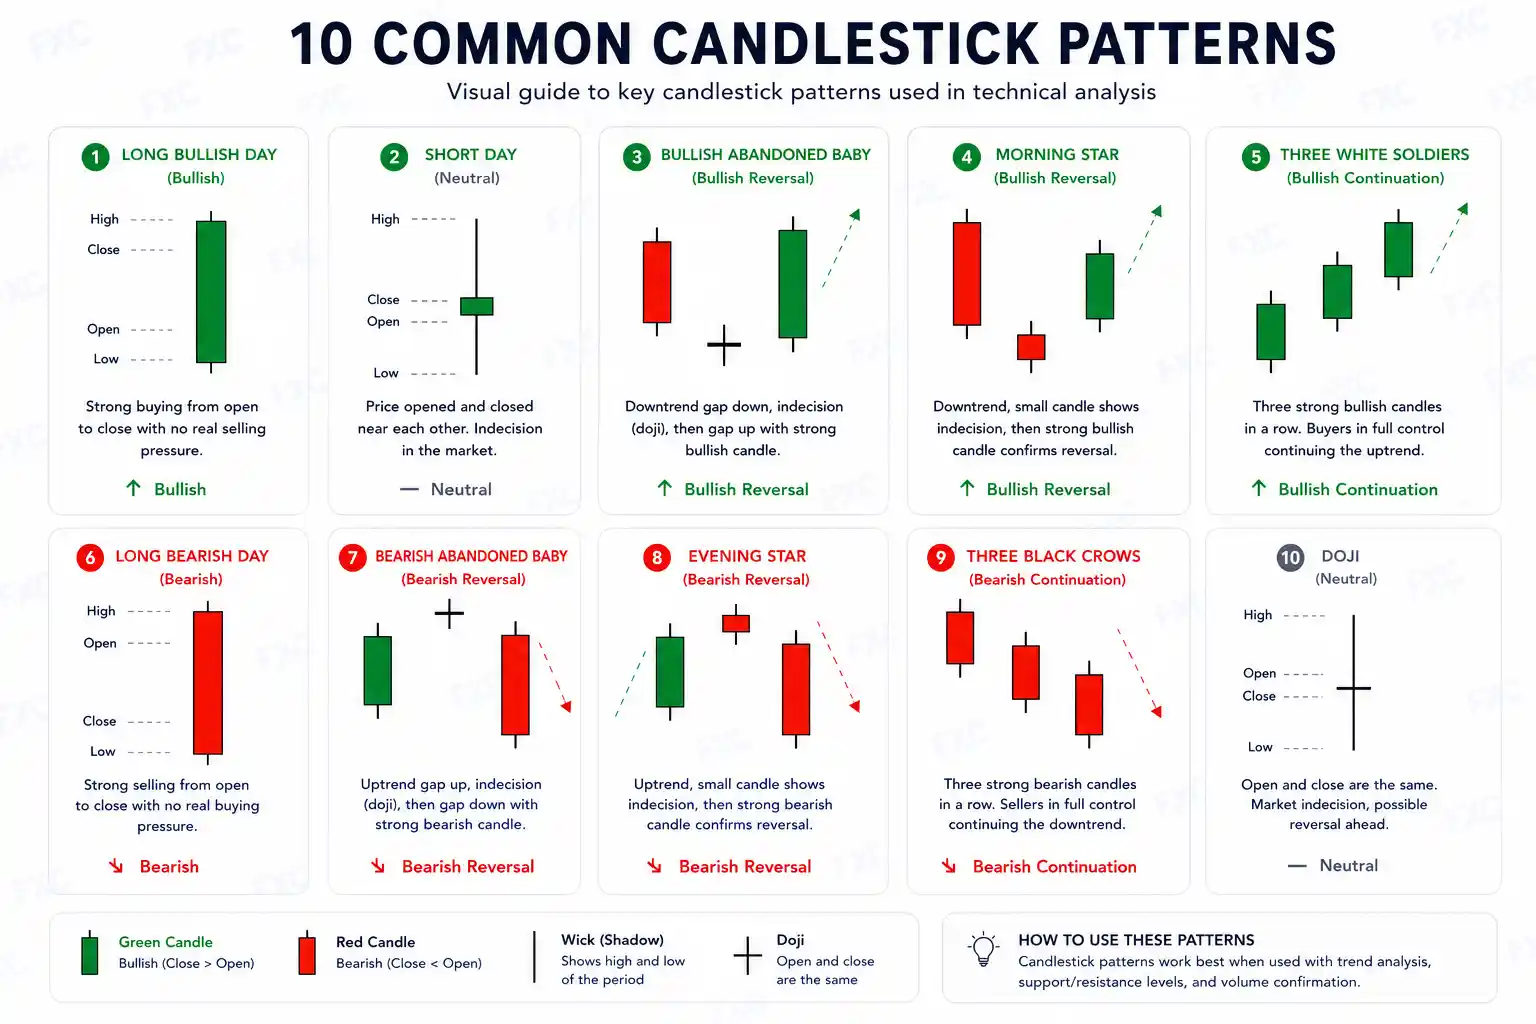
Common single and multi candle patterns
Some patterns are single candle signals and some use two or three candles. Popular examples beginners learn first include doji, hammer, shooting star, bullish and bearish engulfing, and morning and evening stars. Patterns are useful, but their reliability improves with context.
- Doji: open and close are very close, signalling indecision.
- Hammer: small body with a long lower wick, can signal a bullish rejection after a drop.
- Shooting star: small body with long upper wick, can signal bearish rejection after a rise.
- Bullish engulfing: a bullish candle fully covers the prior bearish body and can mark a reversal.
What research says about pattern reliability
Academic and practitioner studies show that some candlestick patterns can produce statistically significant signals in certain markets and timeframes, but results vary by pattern and market. One peer reviewed study on S&P 500 data found the bullish and bearish engulfing patterns can outperform random expectation under specific entry rules. Traders must treat patterns as probabilistic tools not guarantees.
Practical tips for beginners
Tip 1. Use trend and support resistance to filter patterns. A reversal pattern that aligns with a major support level is more meaningful than one appearing in the middle of a range. This approach reduces false signals.
Tip 2. Combine candlesticks with volume or higher timeframe confirmation. High volume that accompanies a reversal candle increases confidence in the signal. Backtesting and context can improve pattern edge.
- Always check the same pattern across at least two timeframes before entering a trade.
- Use a clear stop loss based on the candle extremes and size your position so a single loss does not harm your account.
Common mistakes to avoid
Relying on a pattern alone without context, ignoring spread and slippage costs, and trading patterns on very low timeframes without testing are frequent beginner errors. Treat candles as signals to be confirmed, not as standalone trade orders.
FXC Funded as an alternative for traders
If you are practicing candlestick reading and want a funded account alternative, FXC Funded offers several evaluation and instant funding options that may suit beginner traders. For example, FXC Funded provides instant accounts from 1,000 USD for 59 USD with up to 90 percent profit split and payouts processed within 24 hours. Rules and account sizes vary across their challenge and instant funding plans, so read terms carefully before buying. Specific pricing and plan details include Two Phase and One Phase challenge tiers, and instant funding account sizes and fees.
Practical note: FXC Funded instant funding example shows 1,000 USD instant accounts for 59 USD and profit split up to 90 percent, with payouts every 14 days processed within 24 hours at funded.fxcentrum.com. This can let you trade with larger size while managing your own risk rules. Data on pricing and payout timing comes from FXCentrum product information.
What to expect now?
Candlesticks are powerful visual tools that condense price information into readable shapes. For beginner traders, mastering candlestick anatomy, reading patterns with context and using multi timeframe confirmation will improve decision making. Remember that patterns are probabilistic and work better when combined with trend, support and volume confirmation.
Practice reading candles on a demo account, take screenshots for study, and backtest simple rules before risking real capital. If you want to trade larger sizes without depositing your own capital first, consider FXC Funded instant accounts such as the 1,000 USD account for 59 USD with up to 90 percent profit split at funded.fxcentrum.com. Always review rules and risk limits before trading.


